Hi friends,
One of the reasons I enjoy working with my hands is that I get instant feedback.
Unfortunately, this isn’t always the case with software tools. Often when I click a button or try to scroll, nothing happens for a second or two, shattering the feeling that I’m productively using something tangible.
This happens even in my own web apps, when I know that there’s no network activity, difficult computation, or other justifiable reason why feedback should be delayed.
So I’ve decided to investigate this matter and find out what it takes to actually make a fast web application.
Scoping the problem
The feeling of speed is subjective, and probably depends on both physiological and psychological factors.
I don’t know much about the physiological properties of the human perceptual system:
- Can humans perceive visual changes or auditory changes more quickly?
- How does response time depend on size, color, frequency, etc.?
so I’ll ignore those factors for now.
I don’t know much about the psychological factors either:
- Do “big” changes feel faster or slower than “small” changes?
- Does fast, meaningless feedback feel better than slower, meaningful feedback? For example, after initiating a search, does it feel better to immediately see a spinner, 2 second delay, then results or a 1 second delay then results?
so I’ll ignore those factors too.
Ignoring the feeling of speed, all we have left are cold, hard, physical measurements: What does an application do to draw itself to the screen?
Unfortunately, I don’t know much about the general, low-level operating system and graphics hardware stuff.
However, I do know that Chrome tries to maintain a refresh rate of 60 frames per second, which — finally — gives us a place to start: How can we make sure our application has a new frame ready every (1 second / 60) ~= 16.7 ms?
Drawing a frame
Helpfully, Google provides a rendering performance overview that explains the basics. Chrome draws a webpage (DOM + CSS styles) in roughly four steps:
- Style: Calculate styles for each DOM element by applying selectors, looking at inlined properties, etc.
- Layout: Calculate how much space every DOM element takes up, depending on the various applicable display modes (flexbox, float, inline, table, etc.)
- Paint: Color in all of the actual pixels, which might be on different “layers” (depending on z-index and fancy graphics hardware stuff)
- Composite: Smash all of the painted layers together in the right order to make a final image that can be drawn on the screen
Chrome does lots of caching to minimize which of these steps should be performed on each new frame. For example, if some JavaScript changes only background colors, then on the next frame the “layout” step can be skipped (i.e., the previous layout can be reused), since background colors don’t affect layout.
So, for our application to run as quickly as possible, our JavaScript and these four steps must run within 16.6 ms.
Measuring performance
Profiling JavaScript is easy: just sprinkle profiling statements throughout the code.
Measuring the full browser rendering pipeline is trickier, because rendering is asynchronous. That is, DOM and style manipulation calls don’t block until the changes have been painted; they return immediately, and the browser renders them at its own pace.
Chrome DevTools provides a timeline tool that depicts rendering with helpful visualizations, but the tool can only be run manually.
However, I’d like a “performance test suite” that is fully automated, so that I can performance test every change.
Beyond application code changes, styling changes and browser implementation changes can all affect performance.
Furthermore, this test suite should run as quickly as possible, which means that each individual test should wait as little as possible: Each test should run immediately after last test’s frame renders.
Method 1: Electron API
My first attempt to measure rendering time relied on Electron’s webContents.beginFrameSubscription.
The client JavaScript would perform some action (e.g., change the document.body background color) and measure the time it’d take for the next frame to arrive.
I ran all actions within core.async go routines so that I could “block” and ensure that an action wouldn’t run until the previous action’s frame arrived.
This scheme worked, but unfortunately the beginFrameSubscription listener added about ~70ms of overhead to each frame, making the results useless for the timescale I needed to measure (~1ms).
I opened up an issue about this, but for the time being this approach won’t work.
Method 2: Abusing requestAnimationFrame
I then looked into using window.requestAnimationFrame. In particular, I was curious if requestAnimationFrame callbacks are only called after any pending changes have been fully painted. I couldn’t find a clear answer reading the spec, so I decided to test it by deliberately hanging a requestAnimationFrame callback.
In particular, I setup two a requestAnimationFrame callbacks:
- Callback 1 printed a timestamp to the console
- Callback 2 changed the document body to a random background color and blocked for 2 seconds before returning. (I (ab)used Electron’s IPC.sendSync method to force a block — the render process would ping the main process, which would only send back a return value after 2s.)
Both callbacks queued themselves up for the next requestAnimationFrame tick.
I expected two possible outcomes:
- A timestamp would be printed to the console only every two seconds, indicating that requestAnimationFrame callbacks fire at a rate limited by the slowest callback on that frame
- A timestamp would be printed every 16ms (AKA, every frame at 60 FPS) indicating that frame painting (and the next firing of requestAnimationFrame callbacks) is not limited by a single slow requestAnimationFrame callback
I was hoping for outcome 1, since this would mean:
I could use the time between requestAnimationFrame callbacks as an upper-bound on the rendering speed of certain operations. E.g., if I performed operation X in a requestAnimationFrame callback, I would know that it rendered in less time than the interval between the original and the next requestAnimationFrame callback.
I could use requestAnimationFrame to run the actions I wanted to benchmark sequentially — I wouldn’t need to worry about multiple actions being consolidated into a single repaint.
I ran the experiment and outcome 1 held! Hurray!
I then reused the first method’s code, but instead of using the webContents.beginFrameSubscription callback to indicate the arrival of the next frame (i.e., the end of the action being measured), I used requestAnimationFrame.
Benchmarks
Now that I had a method for measuring paint times, I could finally run some benchmarks. Before wiring up my application, I decided to first test a variety of simple actions to just get a feel for things:
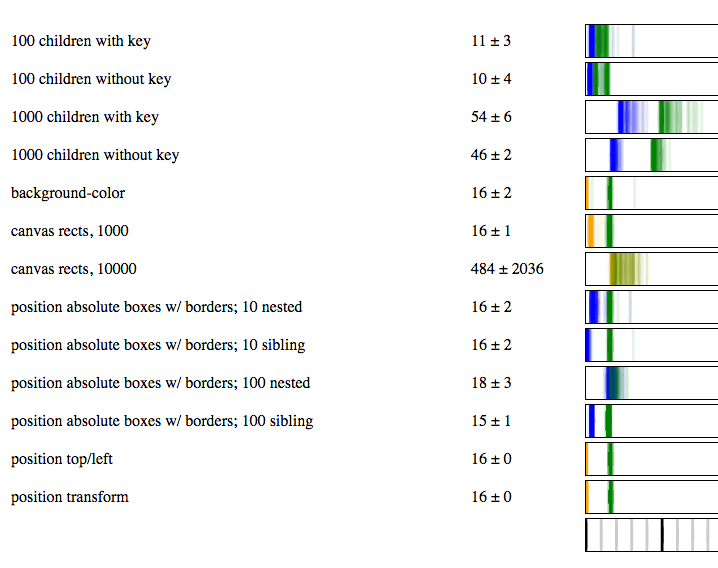
This graphic visually shows the timing distributions, with the numeric mean ± standard deviation of the paint time. Translucent lines are drawn for the JavaScript (blue for React.js, orange for plain JS) and paint (green) timings. The scale at the bottom has ticks every 10 ms.
A few interesting things to note about these benchmarks:
paint timings tend to cluster around 16ms, but not always — the “100 children” paints occur in less than 16 ms. I’m not quite sure how this is happening, since requestAnimationFrame should only fire every 16ms.
nesting elements is computationally more expensive than constructing sibling elements. TBD whether this is overhead from React.js, Rum (a ClojureScript wrapper on React.js), or my own code:
(rum/defc *sibling-boxes
  [num-boxes]
  [:div
   (for [idx (range num-boxes)]
     [:div {:style {:position "absolute"
                    :border "1px solid black"
                    :top (rand-int 100)
                    :left (rand-int 100)
                    :width 100
                    :height 100}}])])


(rum/defc *nested-boxes
  [num-boxes]
  (letfn [(*box [n]
            [:div {:style {:position "absolute"
                           :border "1px solid black"
                           :top (rand-int 100)
                           :left (rand-int 100)
                           :width 100
                           :height 100}}
             (when-not (zero? n)
               (*box (dec n)))])]

    (*box num-boxes)))
Next steps
This code execution and paint timing allows us to know what operations definitely take too long, but it doesn’t let us compare the relative performance of operations that take less than 16 ms.
To get that information, we’ll likely need to dig into Chrome’s high-resolution tracing system — but that’s a post for another month. =)
Have a happy new year!
Best,
Kevin