Variance
← Back to Kevin's homepagePublished: 2016 July 20Started 2013 August, released 2014 April, stopped public sales 2015 December.
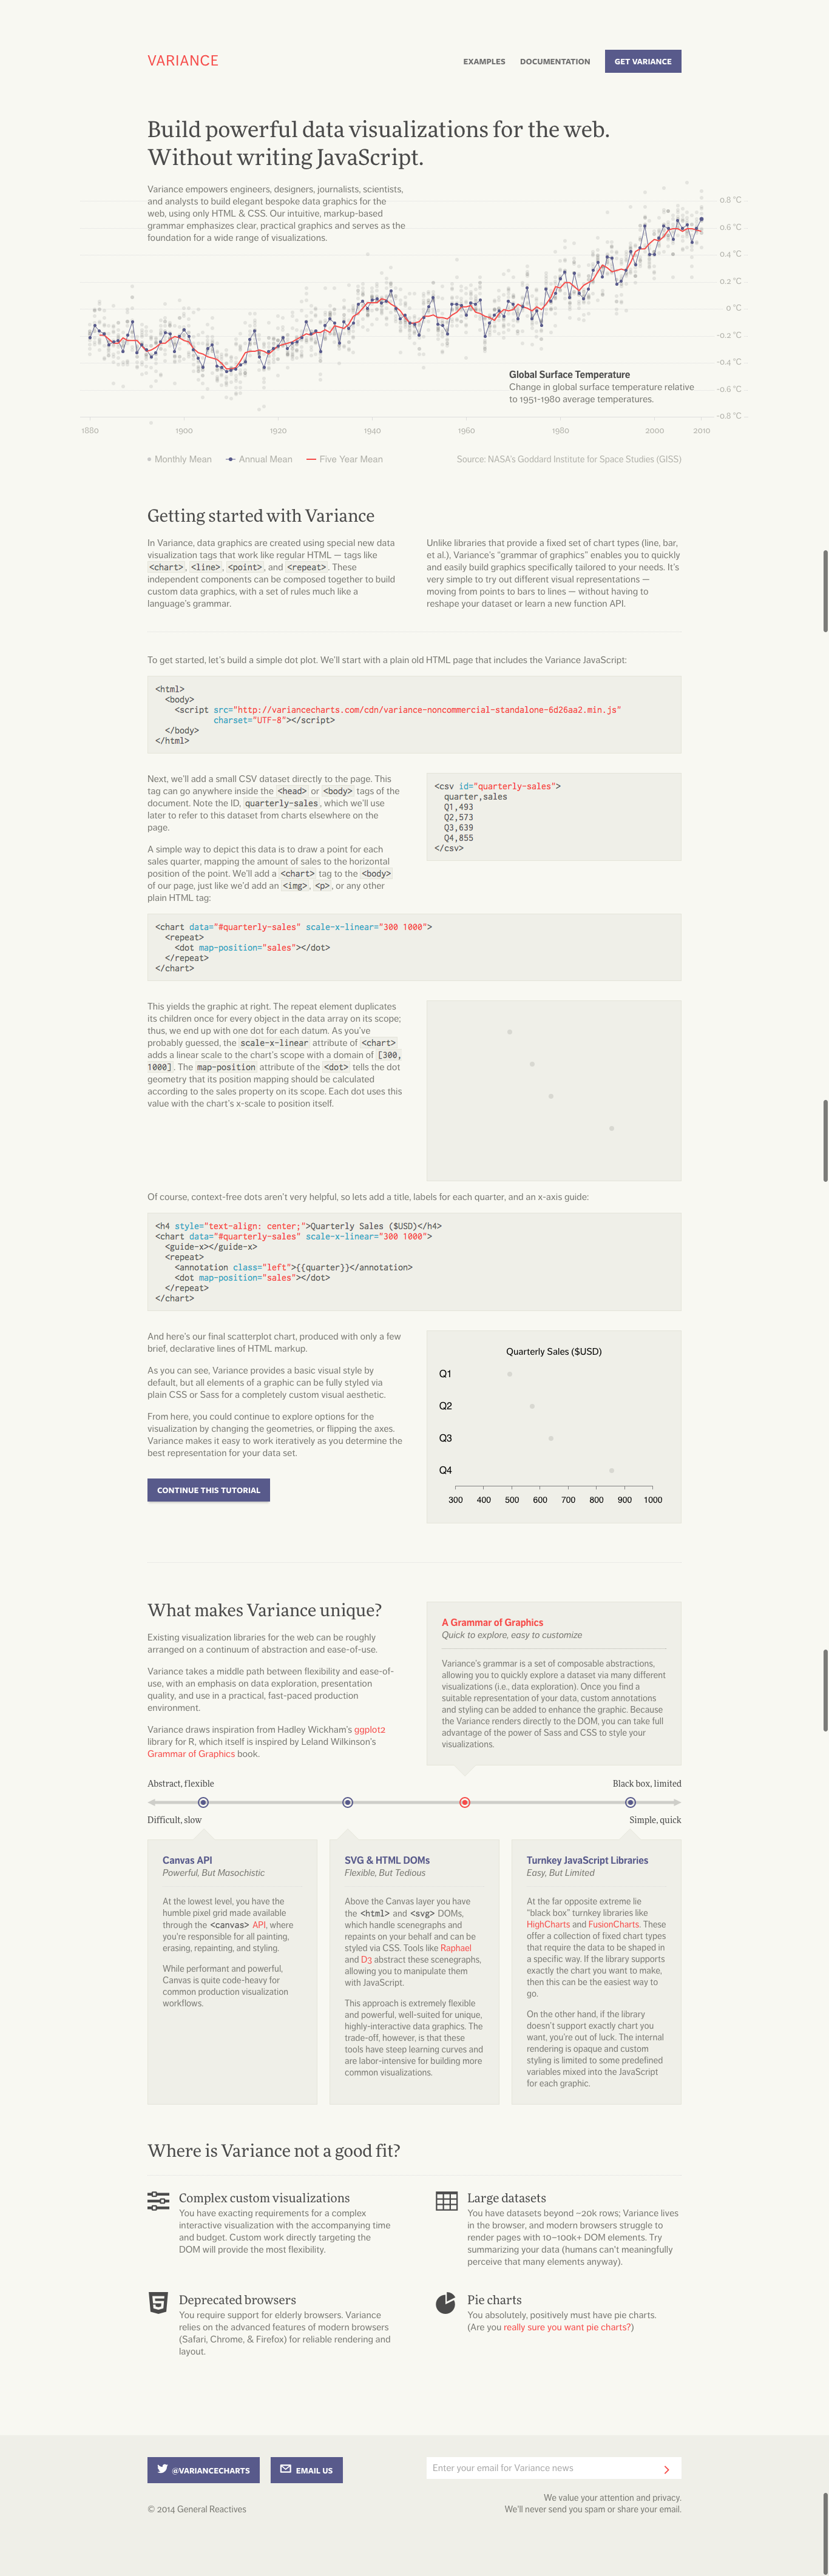
Ryan and I built a data visualization tool that provided more structure than D3.js but didn’t force the user into a “Denny’s menu” of standard chart types like HighCharts. We wanted to make it easier for people to create New York Times style data graphics that blend visual marks with annotation and storytelling.
We neglected user research prior to creating the product and after shipping realized that no one wants a middle road: Most are happy with standard chart types, and the minority who want custom graphics are happy to spend time/money on fully bespoke solutions.
Variance was built on top of Angular.js; I established the formal semantics and implementation, Ryan designed the website and styled the example graphics.
Conceptually, this product was inspired by Wilkinson’s Grammar of Graphics and Hadley Wickham’s R implementation. I presented my early thoughts on this topic in a 2012 talk.
Variance homepage screenshot