Internet of aircon
Last newsletter I mentioned wanting a “remotely controlled remote control” that’d let me activate my bedroom air conditioning while walking home from lunch for the optimal afternoon nap experience.
I am happy to report that my friend Oskar and I have achieved this dream. Here’s how the system works:
- I post (via browser) my air conditioning desires to a web server, which is
- polled (over wifi) by a 2014-era, confined-to-the-living-room iPod, which relays this state (over bluetooth low energy) to
- battery powered PCBs adorably hiding in planters and crown molding, which blink their infrared LEDs at the aircon

I attribute my success in this project to avoiding as many open source “solutions” and other dependencies as possible. Sure, I’ve heard of “Home Assistant” (a Raspberry Pi thing?) and “MQTT” (an IoT publish-subscribe thing?) and in my initial research I found several open source databases of infrared remote control codes. However, I decided to let those yaks roam free and to instead build a solution using the primitive tools I already understood.
I used an oscilloscope to record the “on” and “off” signals from my aircon remote:
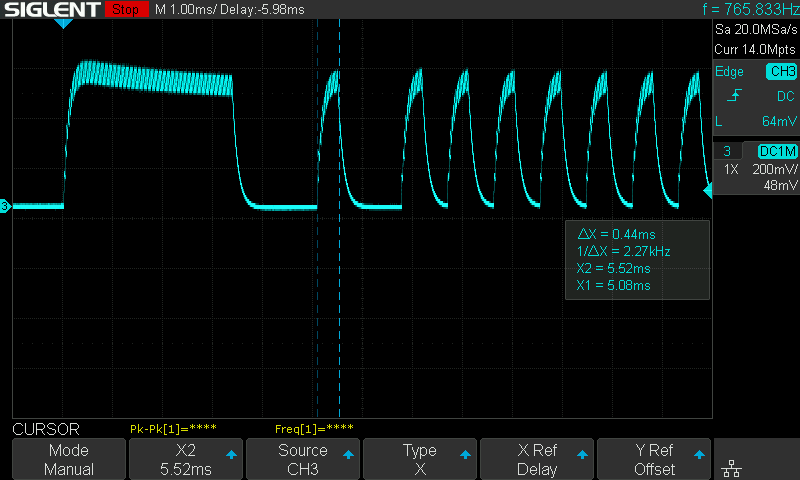
It’s 0.4ms pulses on a 38 kHz carrier wave (note the fuzz on the peaks), with the data encoded in the time between pulses. Fun fact, LEDs work in both directions: You can push current through them to get colored light out, but you can also shine colored light on them to drive current from cathode to anode. The bandwidth isn’t great (as you can see from the slow turn-off), but it’s good enough for our purposes here.
My $2 bluetooth module lacks a PWM peripheral, so to re-create this signal I’m “bit-banging” a gpio pin. I.e., turning it on, running the CPU in a busy-loop for an exact number of cycles to get the right time delay, turning it off, looping again, etc. The “on” signal is 346 bits long — I have no idea what any of them mean, but sending them activates the aircon =)
Bridging this battery-powered bluetooth microcontroller to the Internet was the more challenging part. The obvious solution would be to use a Raspberry Pi or ESP32 to relay signals between a web server and the IR emitters. However, I found it aesthetically distasteful to acquire $30 worth of computer and permanently plug it into a wall socket just to relay a (conceptually) single bit of information once or twice a day.
This desire for minimalism led me to consider the iPod Touch that was already laying around the house. Using this proved to be quite tricky, as iOS (understandably, to preserve battery) prevents apps from doing arbitrary stuff in the background like polling web servers to see if one’s aircon desires have changed.
The “correct” solution here is to use push notifications, but that requires going through Apple’s servers (a dependency!) and the Apple Push Notification Overview doc’s talk of “configuration in your online developer account” and “Apple-supplied cryptographic certificates” gave me flashbacks to the weeks of my 20’s I wasted fighting XCode configuration trying to get The Weathertron into the App Store.
Instead, I took advantage of the fact that iOS will allow a background app to run for a few seconds in response to a bluetooth event, and I just so happen to have complete control of several bluetooth devices…
It’s a horrible hack and I’m ashamed that it works, but my coin-cell-powered emitters send a zero-information bluetooth GATT update to the iPod every 60 seconds for the sole purpose of waking up my app to check for aircon control updates over HTTP. Yes, this makes me a monster, but at least I didn’t have to sell my soul to a world leader in push notification infrastructure no credit card required free trial reserve your spot in our webinar on optimizing push engagement.
Anyway, I’m not losing sleep over it because, well, my bedroom is pleasantly dry and cool…
Spreadsheet electrical engineering
Despite years of associating with Strange Loopers, Recursers, and Dynamiclanders, I’ve managed to valiantly resist the animal desire that lurks within every nerd to share half-baked, speculative ideas regarding end-user programming environments.
Well, today I’m a few iced-latte-with-coffee-jellies deep and, uh, here we are.
I’ll take solace from education luminary Andy Matuschak’s note that
Powerful enabling environments usually arise as a byproduct of projects pursuing their own intrinsically meaningful purposes
and point out that at least the ideas we’ll discuss below aren’t motivated by a crass desire for VC funding or orange website fame, but rather in pursuit of the intrinsically meaningful air conditioning just discussed.
Before we get to the half-baked ideas, I have to set the stage with some electrical engineering. (Feel free to skim this part if you like only computers but not, uh, electricity.)
I’m controlling the aircon via battery-powered blinking infrared LEDs. The more current that goes through an LED, the brighter it is, but the sooner we’ll run through the battery. E.g., a 100 mAh battery will yield (in theory) 100 mA for an hour or 10mA for 10 hours.
So our emitter circuit needs the LED to be bright enough to be seen by the aircon, but no brighter, lest we waste the battery.
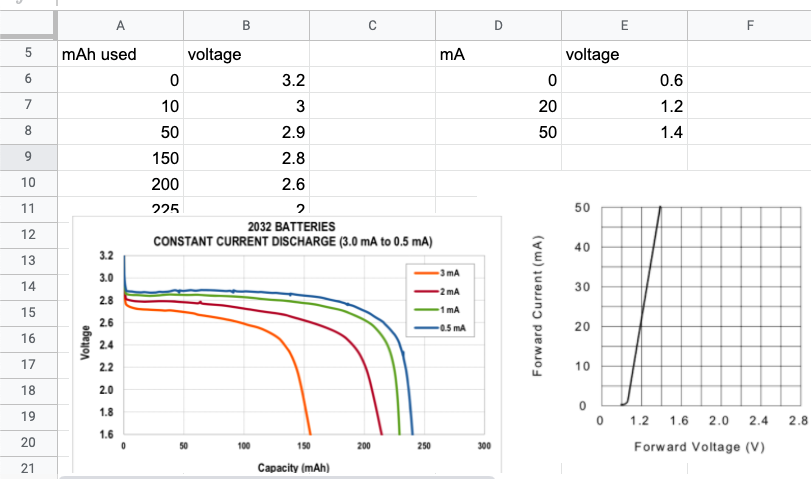
What makes this difficult is the non-ideal behavior of batteries: Their voltage and internal resistance vary as they’re discharged:
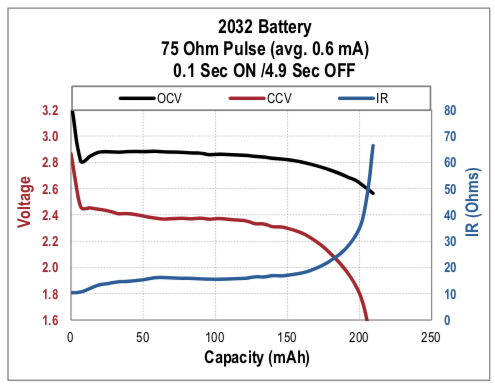
(This and other captivating charts from the Energizer Battery Handbook and Application Manual.)
So our emitter circuit must be designed to work across both the high voltage of a new battery and the lower voltage of a used battery. (Down as far as we can go, until we can’t source enough current to either light the LED or keep the microprocessor / bluetooth radio running, whichever comes first.)
Perhaps the simplest circuit has the microcontroller switching the LED via a low-side MOSFET:
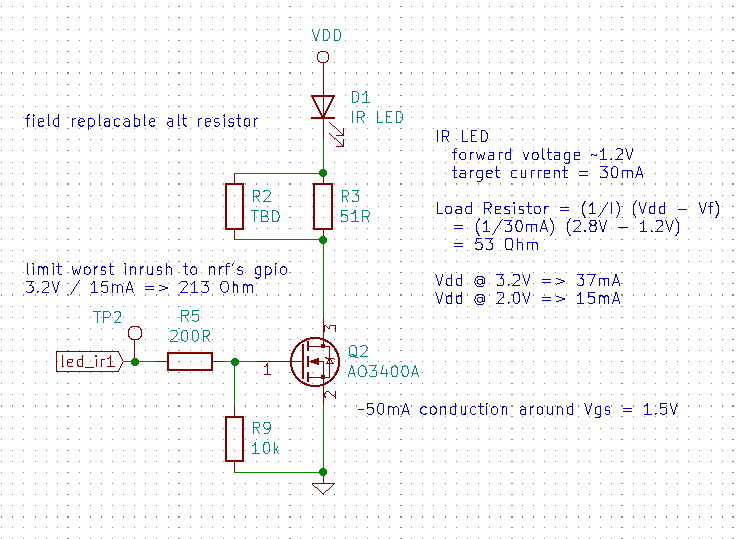
Here the LED current is limited by a series resistor (R3) and ranges between 37 mA (when the battery is new) to about half that (when the battery is dead to us). This circuit can’t be the most efficient, since the varying current means we’re too bright until we suddenly become too dim — never “just right”.
A second circuit uses a bipolar junction transistor (Q4) for current feedback:
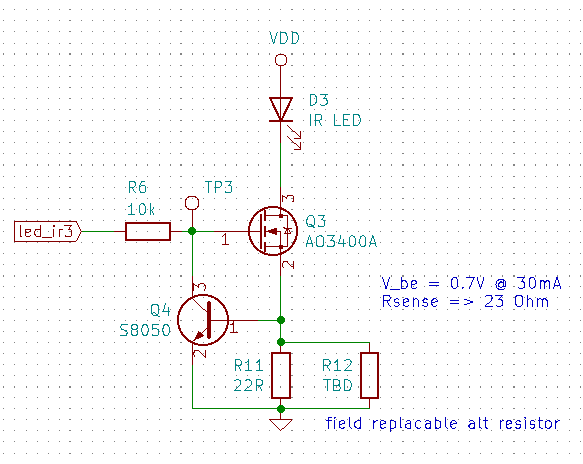
Here the LED will be driven with a constant current, even as the battery voltage drops. However, the transistor “raises the floor” under the LED by 0.7 V — so perhaps we’ll run into the ground earlier than we would’ve in the first circuit.
A third circuit plays the same feedback game, but uses an op-amp and microcontroller reference voltage to keep the floor lower (raising it just 0.12 V):
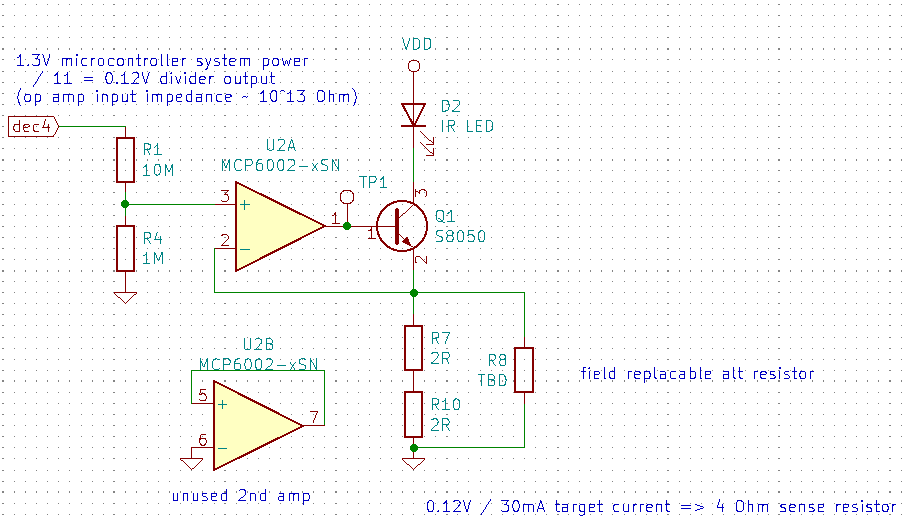
When designing these circuits, my “tools for thought” were:
- qualitative discussions of circuit topologies found via Google
- quantitative back-of-the-envelope calculations of the limits done by hand in the schematic margins
For evaluating feasibility, both of these tools are great, and I’m fairly confident that all of these circuits will blink LEDs.
However, neither Stack Exchange discussions nor basic algebra lets me compare these designs along the dimension I actually care about: How many aircon on/off transmissions can they send before the battery dies?
I suspect the third circuit will yield the most transmissions, but how many more? And is it worth the 10x increase in part cost?
To answer that, we have to do the math.
What I’d love is a slightly more advanced back-of-the-envelope calculation than my hand algebra. I want to spend an hour to get an order of magnitude estimate (1,000 transmissions? 100,000?) for each circuit.
What are my options here?
Dedicated electronics software like LTspice and Falstad’s online simulator are great for understanding circuit dynamics (why is my op-amp oscillating?), but can’t be applied directly to my domain question, “how long will the battery last?” (At least, as far as I know — would love to hear from any electrical engineer readers if I’m wrong here.)
NumPy Hahaha, maybe if I were a seasoned data scientist I’d have a chance in hell of coding up an arbitrary numerical circuit analysis in an hour, but Vegas odds are 50/50 that after an hour I’m either still waiting for
conda pip install virtualenv egg wheel jupiteror arriving at an incorrect result due to copy/pasting a popular-yet-subtly-wrong StackOverflow answer.Mathematica has fantastic docs, charting, and unit support, and worked great last time I needed some numerical integration (re: insulating a workshop). However, I suspect Mathematica might still be closer to the NumPy experience (and, unfortunately, the copy I’ve been lovingly carrying around since undergrad is currently packed in storage).
A spreadsheet Duh.
Here’s how newsletter reader Valentin and I setup the sheet for the first circuit.
First, we transcribed a few charts from the PDF datasheets. Satisfyingly, screenshots can be pasted alongside the data:
Then we setup an iterative calculation of the current flowing through the LED:
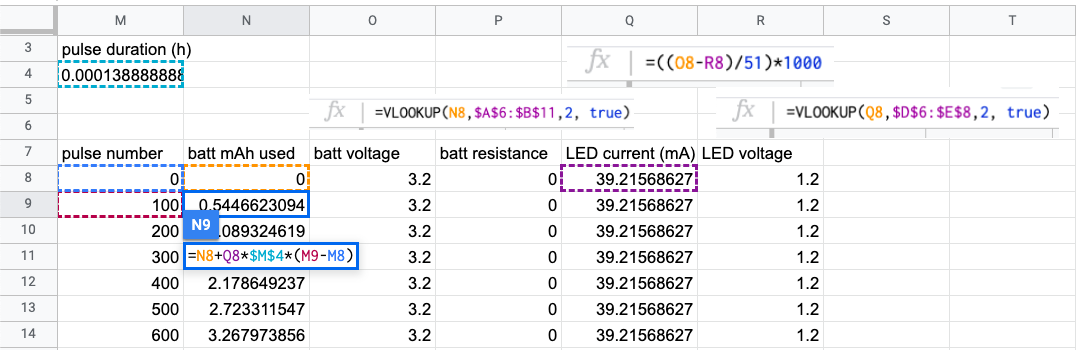
A few things going on here:
- each row is a “step” of an iterative calculation; this spreadsheet is basically a giant unrolled loop
- the battery voltage and LED forward voltage are referenced via
VLookupfrom the transcribed datasheet graphs - there’s a circular dependency: the overall current depends on the voltage drop across the LED, which itself depends on current — luckily spreadsheets will helpfully pop up a dialog the first time a circular dependency is introduced and we can simply select “enable iterative calculation” (no REPL has ever been this kind to me)
Let’s start with what went well. Foremost, we threw this together in under an hour and got to a useful conclusion: The least efficient circuit will easily work for tens of thousands of transmissions, so we don’t need to worry about this stuff at all!
Furthermore, being able to see intermediate values is quite helpful (not a novel observation about spreadsheets, I know). E.g., seeing that the first few rows of the “loop body” barely changed prompted us to introduce a “step size” of 100 transmissions. Seeing the values also helped us notice early and correct mistakes like forgetting to convert between amps and milliamps.
That said, not everything went perfectly, which (finally) brings us to the speculative discussions.
Graphical data entry
From what I can tell, the only data format used by electrical engineers is PDF. Honestly, I’m fine with that — custom-drawn charts convey a ton of useful information that’d inevitably be discarded in some schema-fascist’s data modernism. (Seriously, go ahead and try to fit an op-amp datasheet into XML.)
For my back-of-the-envelope calculations, all I really need is ~10 points/curve, which should be easy to extract manually with a decent UI. E.g., click on a handful of points and enter coordinate values to fix them on the proper scale. I’m skeptical that computer vision (and its risk of misidentifying grid lines and smudges as data marks) would be net faster than well-designed UI, but I’d love to be wrong here.
Aesthetically, I like the “honesty” of inputting data this way too. Like, bro, we just traced a blurry screenshot of a graph — obviously we shouldn’t trust our results beyond a single significant figure.
Interesting unknowns here are how to expose such data tables to the rest of the spreadsheet.
We used VLookup, which returns the value associated with the first key smaller than the lookup value.
However, our use case would be much better served by something that interpolates the returned value based on our lookup — i.e., the value on the line drawn between the two closest transcribed points rather than the leftmost point.
(This, like any computation, can be done with VLookup, but it’s some work.)
Actually, it’d be useful if we could interpolate not just between transcribed points, but also between full curves. Take the battery voltage graph, for example: There’s a 25% capacity difference between the red 2mA and orange 3mA curves, so if we know our system draws an average of 2.5mA, being able to start our calculations that would go a long way towards improving our calculation accuracy.
Uncertainty / distributions
In the spirit of “don’t forget you’re sketching”, it’d be interesting to lift primitive type numeric types to an interval or distribution. That is, allow numeric values like “between 2 and 5” or “17 +/- 5%” and propagate those ranges through all calculations.
The wonderfully-named Guesstimate tool does this to great effect, making it quick to run and visualize Monte Carlo simulations. (See also: Causal.app.)
Units
While we’re extending the primitive numeric type, we might as well throw on units.
I find units to be both a helpful link back to the real world and an effective “sanity-check” for calculations. They contextualize magnitudes (I expect the battery to last more than a few nanoseconds) and serve as a dimensional check on structure (if I get hour-amps instead of hours, I must have forgotten to divide by current somewhere).
Units also allow values to be expressed in “familiar” terms. In the aircon spreadsheet we wrote out a “pulse duration” cell to reconcile one input (the aircon signal takes 0.5s to transmit) with another (the battery capacity in milliamp hours). A unit system would allow us to use these values directly, without writing out the “seconds in an hour” calculation ourselves.
Note we’re talking about units here, not just dimensions, which means implementation would require more than just representing all values as (number, unit) pairs and updating operators accordingly.
There are some interaction and display considerations here (e.g., when should the system multiply by 1000 to turn milliamps into amps?), but luckily there’s quite a bit of prior art (Mathematica, Frink).
I suspect a simple system with good defaults would go a long way.
Iteration
For our spreadsheet, we iterated by copy/pasting rows and stopping after it became clear that LED current wouldn’t be the limiting factor on battery life.
But if we didn’t stop manually — if we wanted to calculate an exact answer like “how many transmissions”, how would we setup the calculation?
Presumably we’d add a column for a termination condition (does enough battery remain to drive at least 20 mA through the LED?), copy/paste rows down to infinity and then do a VLookup to save us from having to scroll that far?
In terms of the visual structure of the calculation, we introduced a step size (and thus calculation error) just to limit the number of rows. Ideally we’d have alternatives: Perhaps a special iterative calculation table could be resized show only the important first few and last few rows, with the rest hidden by default. We’d still want the option to “step in to the debugger” of looking rows in the middle of the iteration, but most of the time we’d probably only care about the top and bottom.
This could be achieved in a traditional spreadsheet by moving the iterative calculation to a separate sheet, but that’d cause friction both in the initial move and also the subsequent maintenance and understanding of the inter-sheet formula relationships.
Another challenge we faced while building our iterative calculation was updating the column formulas. E.g., after discovering our conversion mistake regarding milliamps and amps, we had to do some fancy hotkeys and mouse clicking to clear every cell in the column (containing the old formula), write in the corrected formula, and then “ride the range” to copy the correcte formula down the column.
Formula entry
I mean, look at this again:
This is a simple calculation that I wrote and I can’t tell what’s going on, even after annotating the screenshot so all the formulas are visible!
A huge part of the problem is the Battleship-esque variable names, though having to cram everything onto the single line of the formula input bar isn’t helping either.
What would alternative formula languages look like? Fully typeset mathematical notation (see again, Mathematica) would be nice, sure, but I’m more interested in how a readable formula would tie back to individual rows/columns/cells.
Text-based programming languages “solve” this by not showing the data: The formulas are all you see, and it’s on you to print (or tediously step through with a debugger) to see values.
Spreadsheets do the converse: The formulas are hidden and only shown one-at-a-time when you click on their cell. (Or, sure, toggle “show formulas” to see them all together in their one-line glory.)
What design would allow one to see both the calculated values and their backing formulas simultaneously?
Can we abstract common formulas so they’re only shown once, but still make it clear where their “call sites” are?
Excel’s Tables and structured references alleviate some of these issues of understanding and fast-editing by specializing formulas to operate full columns. (Though of course they have their own expressive problems: It’s not obvious how to setup boundary conditions and row-relative references are best done by reifying an index column for performance reasons.)
Other prior art includes truth tables and more powerful visual conditional languages like Jonathan Edwards’s No ifs, ands, or buts.
Is there a product here?
That was a lot of handwaving in various directions: Yeah, it’d be cool to trace graphs, easily model distributions, have units, have a bit more formula structure (but not too much more!), etc., etc. Pursing any of these directions could lead to a slightly nicer spreadsheet experience.
But “slightly nicer” isn’t exactly a compelling product pitch. These are all very interesting technical questions — I’m sure they’ve been explored in various Strange Loop talks and academic papers. (Please email me your favorites!)
But it’s telling that the tool Valentin and I used is the one we knew would be “good enough” for our hour of technical sketching: Google Sheets.
I run into this status quo everywhere: There’s a popular tool that works OK and some much more powerful (but obscure, hard to use, etc.) tools that a minority of experts use. If only we could make the powerful stuff more accessible!
Personally, I’ve fallen for this siren song several times now.
Variance was for people who wanted more than just off-the-rack data visualizations, but didn’t want to go as far as programming in D3.js or hand-drawing everything in Illustrator. Subform was for visual designers who wanted to think about app layout and state, who didn’t want to dirty their hands in the implementation media (HTML/CSS, XCode).
Neither of these projects were successful, and in hindsight I believe a big reason is because no one finds the middle compelling. For the casual folks, the middle is further than they want to go — it seems like unnecessary extra effort, more concepts to learn, less “intuitive”, etc.). For the people who appreciate the inherent problem complexity and are motivated to put in the work, the payoff isn’t there compared to just learning the real expert tool.
In the case of spreadsheets, browsing over to Google Sheets and making a mess of arithmetic is exactly as much effort as most people (myself included!) are willing to invest. If we actually needed to go deep, then we’d pick up a domain-specific thing: we’d do statistics with STAN, circuit modeling with LTSpice, accounting with QuickBooks, etc.
This theory isn’t parictularly useful — why is the current feature set of spreadsheets “good enough”? In what contexts?
The interesting bits, as always, are on the margins: What specific functionality keeps people on Excel vs. Google Sheets? What motivates people to give up spreadsheets and move over to Airtable? And why is Airtable good enough compared to Rails?
It could be that there’s a ceiling for general purpose technology: Spreadsheets and programming languages can’t be improved without loss of generality. In terms of “solving the problem at hand”, no spreadsheet primitive can do better than Gusto’s “send W-2s to my employees” button; no amount of magical new Ruby on Rails syntax can compete with Shopify.
Not only are these specialized solutions easier to scope and build, they’re 100x easier to market, sell, and turn into businesses. Once you develop the “send W-2s to my employees” button, it’s obvious what to do next — go find small businesses and tell them about it! (Joel Spolsky discussed this “vertical vs. horizontal” tension with Trello, his generic list-of-lists product.)
If you make a spreadsheet with units and automatic sensitivity analysis, who’s going to get super excited about that? The dozen engineers who’ve been meaning to get around to it, though it hasn’t actually been pressing enough for them to have already developed a solution? Not a great market!
Perhaps one solution is to lean into the social benefit / techno-puritian angle: pitch post-exit nerds to finance an improved spreadsheet, not out of an expectation that any of the generated value will be captured, but rather to quench the burning desire in their hearts to deliver the unwashed masses from the devils of copy/paste errors, incomplete range references, and false precision. (Or perhaps to alievate their conscience for having made a fortune on top of JavaScript, YAML, and janky Salesforce widgets or whatever.)
Anyway, I bet there’s some interesting stuff here reachable within a few person-years. Let me know if y'all have any favorite PhDs / failed startups / software-from-the-90’s-we-forgot-about on this topic. (Or if you want to patron $500-1MM, in which case I’ll get a few folks together…)
Newsletter meta-discussion
I write these newsletters locally in markdown and paste the generated HTML into TinyLetter just to send them out. Unfortunately, TinyLetter recently updated their online editor such that previewing causes all the images to be rewritten with a 0px height. This isn’t a dealbreaker — the past few months I’ve just pasted HTML and sent immediately (no preview, YOLO).
However, if I’ve learned anything on the Internet, it’s that the time a big company rediscovers that it has been running their talent acquisition’s product in basement closet (wow, forgot we bought that!) is the time that product’s users need to start looking for the exits.
Y'all have any infrastructure suggestions for our newsletter? I don’t want to market to you, track link open rates, or otherwise optimize our engagement. Yeah, I know about Substack, but I’m not sure about letting something that thirsty into our relationship.
ALSO: I’ve been sending newsletters out monthly, covering several topics and weighing one to four thousand words. Do you like this format? Or would you prefer more frequent (every 2 weeks?), single topic newsletters?
Misc. stuff
I’m speaking at Papers We Love Taipei September 9th on component-based program synthesis. See you there!
It’s the Hungry Ghost Festival this week and Taiwan News has some wonderful tips:
- Make offerings, but not too much lest the ghosts start hanging around outside your home/business (bad luck!)
- If you offer pre-packaged food like a bag of chips, make sure it’s open so that a single ghost doesn’t take the whole thing. Sure! I once saw someone eat an entire bowl of salsa at a party and have no reason to think they’d behave any better in the after-life.
Teardown: A digital pregnancy test is a 4 MHz computer and LEDs that reads the strip for you.
A rare wholesome issue thread — this “open source” thing might actually have some merit.
Non-POSIX filesystems, some nice ideas from the the 60’s and 70’s that are still nice.
In 1793 “Five men agreed to live on a deserted 21-square-mile island in one of the most remote places on earth for 1.5 years.” To hunt seals.
If you want more battery-powered design constraints, see Ganssle’s notes on ultra low power design.
3d-printing on fabric substrate to create foldable mechanisms.
Several readers replied to last newsletter’s discussion on low-probability risks asking about China invading Taiwan. I looked into this question, and it turns out shots are already being fired in the comments of a YouTube military strategist / puppet’s video on the subject.
Speaking of risk, check out this reasoned and numerate discussion of humanity’s existential risks (spoiler: it’s mostly ourselves).
In 1995 an Australian anti-rabbit bio-weapon escaped the lab and killed 60% of rabbits on the continent.
“Apple, Google, Epic, and the Sherman act, an explainer.”
“While we do not know of any use cases for solving Diophantine equations inside an optimizing compiler, we are gratified to know that the power is there should it be needed.”
“How to ask questions well, asynchronously.”